
A real-time monitoring screen based on Dashing and Sinatra
PostgreSQL Dashboard is simple monitoring tool that provides a live activity report of a PostgreSQL instance.
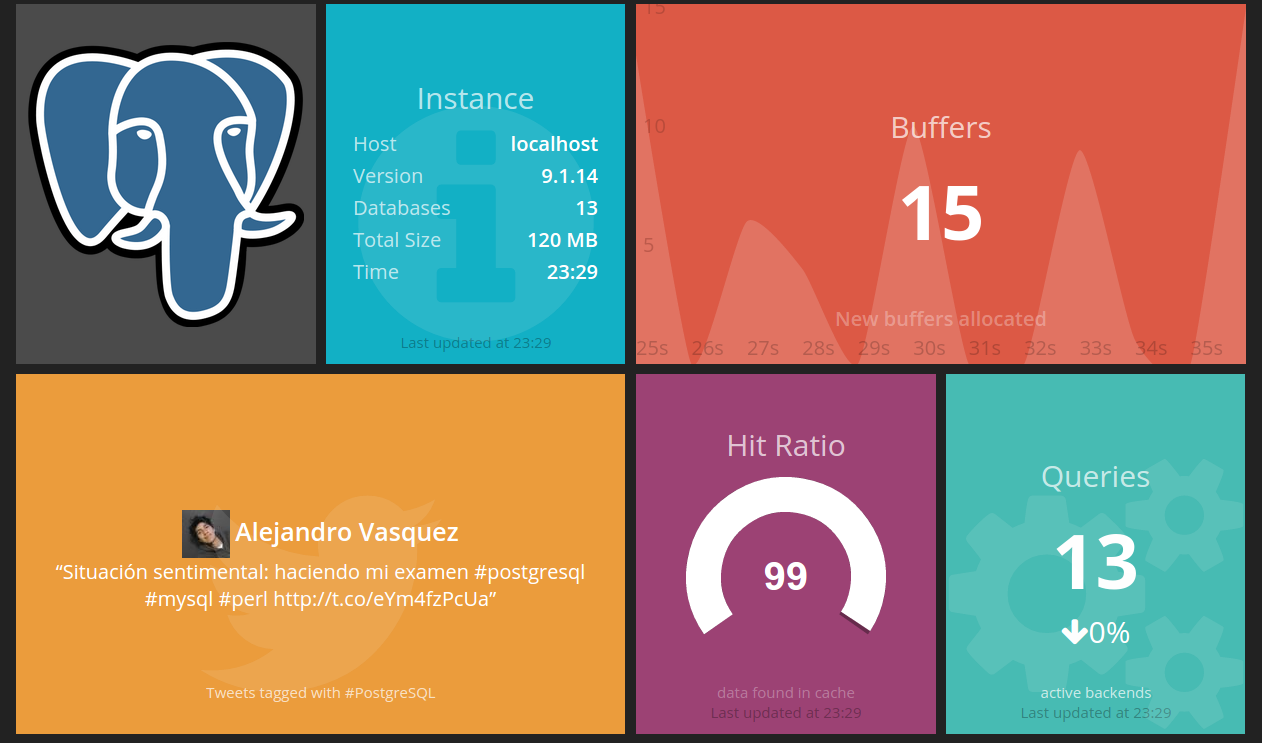
It is designed to be displayed on a large screen in a monitoring room or an open space office. The current dashboard is currently composed of 5 widgets :
- General Info : Version, number of host databases, etc.
- Hit Ratio : The % of data found in cache
- Buffers : The number of new buffers allocated
- Queries : The number of active queries currently running of the instance
- Twitter : A glimpse of the #PostgreSQL feed
Extensibility
Adding a new widget should be fairly easy. This tool is designed so that you can write a custom widget to display the stats you find relevant or a dynamic graph on some “business logic” valuation.
The layout is also entirely flexible. You can easily drag’n’drop any widget to put it wherever you want on the screen. And HTML code of the dashboard can be modified for specific needs, such as specific screen dimensions.
Links & Credits
Some parts of this tool are based on the work done on other PostgreSQL tools, especially pgstats and pgcluu
PostgreSQL Dashboard is an open project distributed under the PostgreSQL licence. Any contribution to build a better tool is welcome. You just have to send your ideas, features requests or patches using the GitHub tools.
Links :
blog comments powered by Disqus